Presented By: Physics Workshops & Conferences
Special Data Visualization Workshop
Christopher Gutiérrez (University of British Columbia)

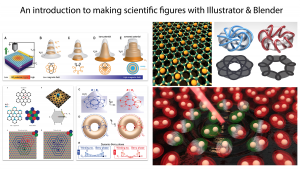
Scientific research can be a slow and laborious process. The absolute final step in the process is to then communicate your exciting scientific findings to other scientists both in and outside of your field. Yet it is sometimes at this final step where the least amount of time is spent. In this interactive 90-min workshop, I will give a basic introduction to making scientific figures using Adobe Illustrator and Blender3D. I will go over the basics of these software, how they treat objects, and the useful hotkeys for speeding up workflow. In the first hour, I will introduce Illustrator and cover topics like workflow; importing external plots/figures; creating patterns (i.e. schematic atomic lattices); and creating 3D structures. In the last half-hour I will give a brief introduction to Blender, a powerful (and free) open-source software for rendering 3D objects. I will go over the basics of how Blender treats objects/structures, lighting, and rendering a scene.
All are welcome, but it is strongly recommended that participants bring laptops with Adobe Illustrator CC (or at least CS6) and Blender3D pre-installed so that you can follow along with the demos.
All are welcome, but it is strongly recommended that participants bring laptops with Adobe Illustrator CC (or at least CS6) and Blender3D pre-installed so that you can follow along with the demos.