Skip to Content

Sponsors

No results

Keywords

No results

Types

No results

Search Results

Events

No results
Search events using: keywords, sponsors, locations or event type
When / Where

Presented By: Museum of Anthropological Archaeology

A Hole Lot of Uncertainty: Probabilistic Evaluation of Archaeological Subsurface Survey

Dr. William Pestle, Director of Education, U-M Kelsey Museum of Archaeology
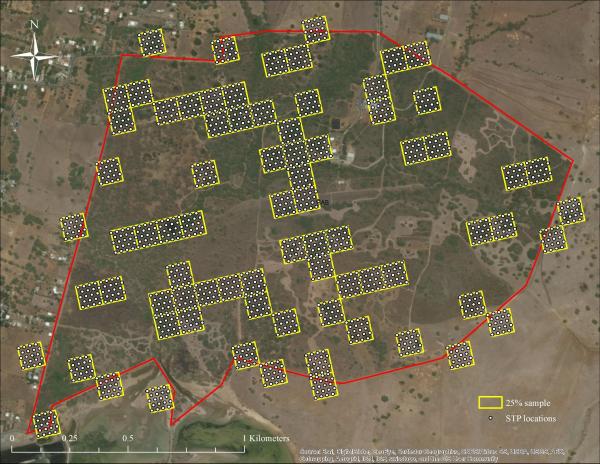
Satellite map showing a red site boundary containing scattered yellow grid squares (25% sample) filled with dense grids of dots representing shovel test pit (STP) locations. Satellite map showing a red site boundary containing scattered yellow grid squares (25% sample) filled with dense grids of dots representing shovel test pit (STP) locations.
Satellite map showing a red site boundary containing scattered yellow grid squares (25% sample) filled with dense grids of dots representing shovel test pit (STP) locations.
In regions with low surface visibility, archaeologists often turn to systematic subsurface testing for purposes of site location. While numerous factors impact both the effectiveness and efficiency of these prospection efforts, “cookie-cutter” survey strategies are often employed without a thorough examination of their costs and benefits, and the results of such surveys are subject to erroneous interpretation when factors like effectiveness and limits of detection are not taken into account. In this presentation, we examine how a simulation-based approach that incorporates prior data can probabilistically determine the effectiveness and efficiency of different survey strategies. Beyond permitting the design of survey strategies that maximize the possibility of site detection and husband precious resources (time, money), this method also permits the generation of post hoc correction factors that make possible the critical evaluation and direct comparison of previous survey results.

Satellite map showing a red site boundary containing scattered yellow grid squares (25% sample) filled with dense grids of dots representing shovel test pit (STP) locations. Satellite map showing a red site boundary containing scattered yellow grid squares (25% sample) filled with dense grids of dots representing shovel test pit (STP) locations.
Satellite map showing a red site boundary containing scattered yellow grid squares (25% sample) filled with dense grids of dots representing shovel test pit (STP) locations.

Explore Similar Events

  •  Loading Similar Events...

Keywords


Back to Main Content